

Hazy Spring Rain...
The good, the climate tie, and will it be enough?

(I swear this article isn’t about me but…) I walked out of the world of local news on April 25th. On April 28th, spring storm season kicked into high gear and pushed round after round after round after round after round after round after…(you get it)…of storms through Texas and the Brazos Valley. The end result? This nearly daily text message from newly minted Chief Meteorologist Max Crawford:

and the 15th wettest May in Bryan-College Station’s 142 years of record keeping. Easterwood Airport slurped up a total of 9.10” of rain over the last 31 days. That is four and a half inches above what is considered typical for the fifth month of the year in the Brazos Valley. For those along and east of the Navasota River — which crested at historic levels at Highway 79 and spent most of the month in a state of major flood — rain gauges spilled over with as much as 15” to 25” of saturating rainfall.

FOR THE RECORD: A significant first 151 days of the year
On average, Bryan-College Station is expected to collect just a hair over 40” of rain in a “typical” year. To be exact: 41.75” per the 30-year average.

As of May 31st, enough rain has fallen (officially) to account for 76% of a typical year of rain for the Brazos Valley. The last time we had this much rain before the start of June? 1929 (95 years ago). The last and only time we had more rain than this going into June? 1900 (124 years ago).

For comparison, by this point last year, Easterwood Airport had 18.95” of rain collected, 45% of the years expected rain and the 44th wettest January - May on record. When you dive into the numbers, you’ll see most of that work was carried on the back of April alone. A singular month that couldn’t stop us from the freight train of heat that was coming to allow 2023 to claim the crown as the hottest of record in just about every way.
This is a climate blog, right?
Right. So how does human-caused climate change attribute to this wet and stormy first half of the year?


For starters: it is supercharging the water cycle. It is bringing heavier rainfall extremes — and related flood risks. Once in a 50-year rain events are now occurring three times in 50 years (per the IPCC). Those rain events cost money. Inland flooding in the U.S. caused $230 billion in damages from 1988 to 2021. Over one-third (37%) of those damages are attributed to precipitation changes due to climate warming. That’s $84 billion in past flood damage attributed to human-caused climate change.
Short-bursts of rain leads to more flooding as the atmosphere holds more moisture in a warming climate. The other piece of this soggy puzzle is rainfall now falls more disproportionally across the globe. Climate change is causing droughts to get more drought-y and floods to get more flood-y.
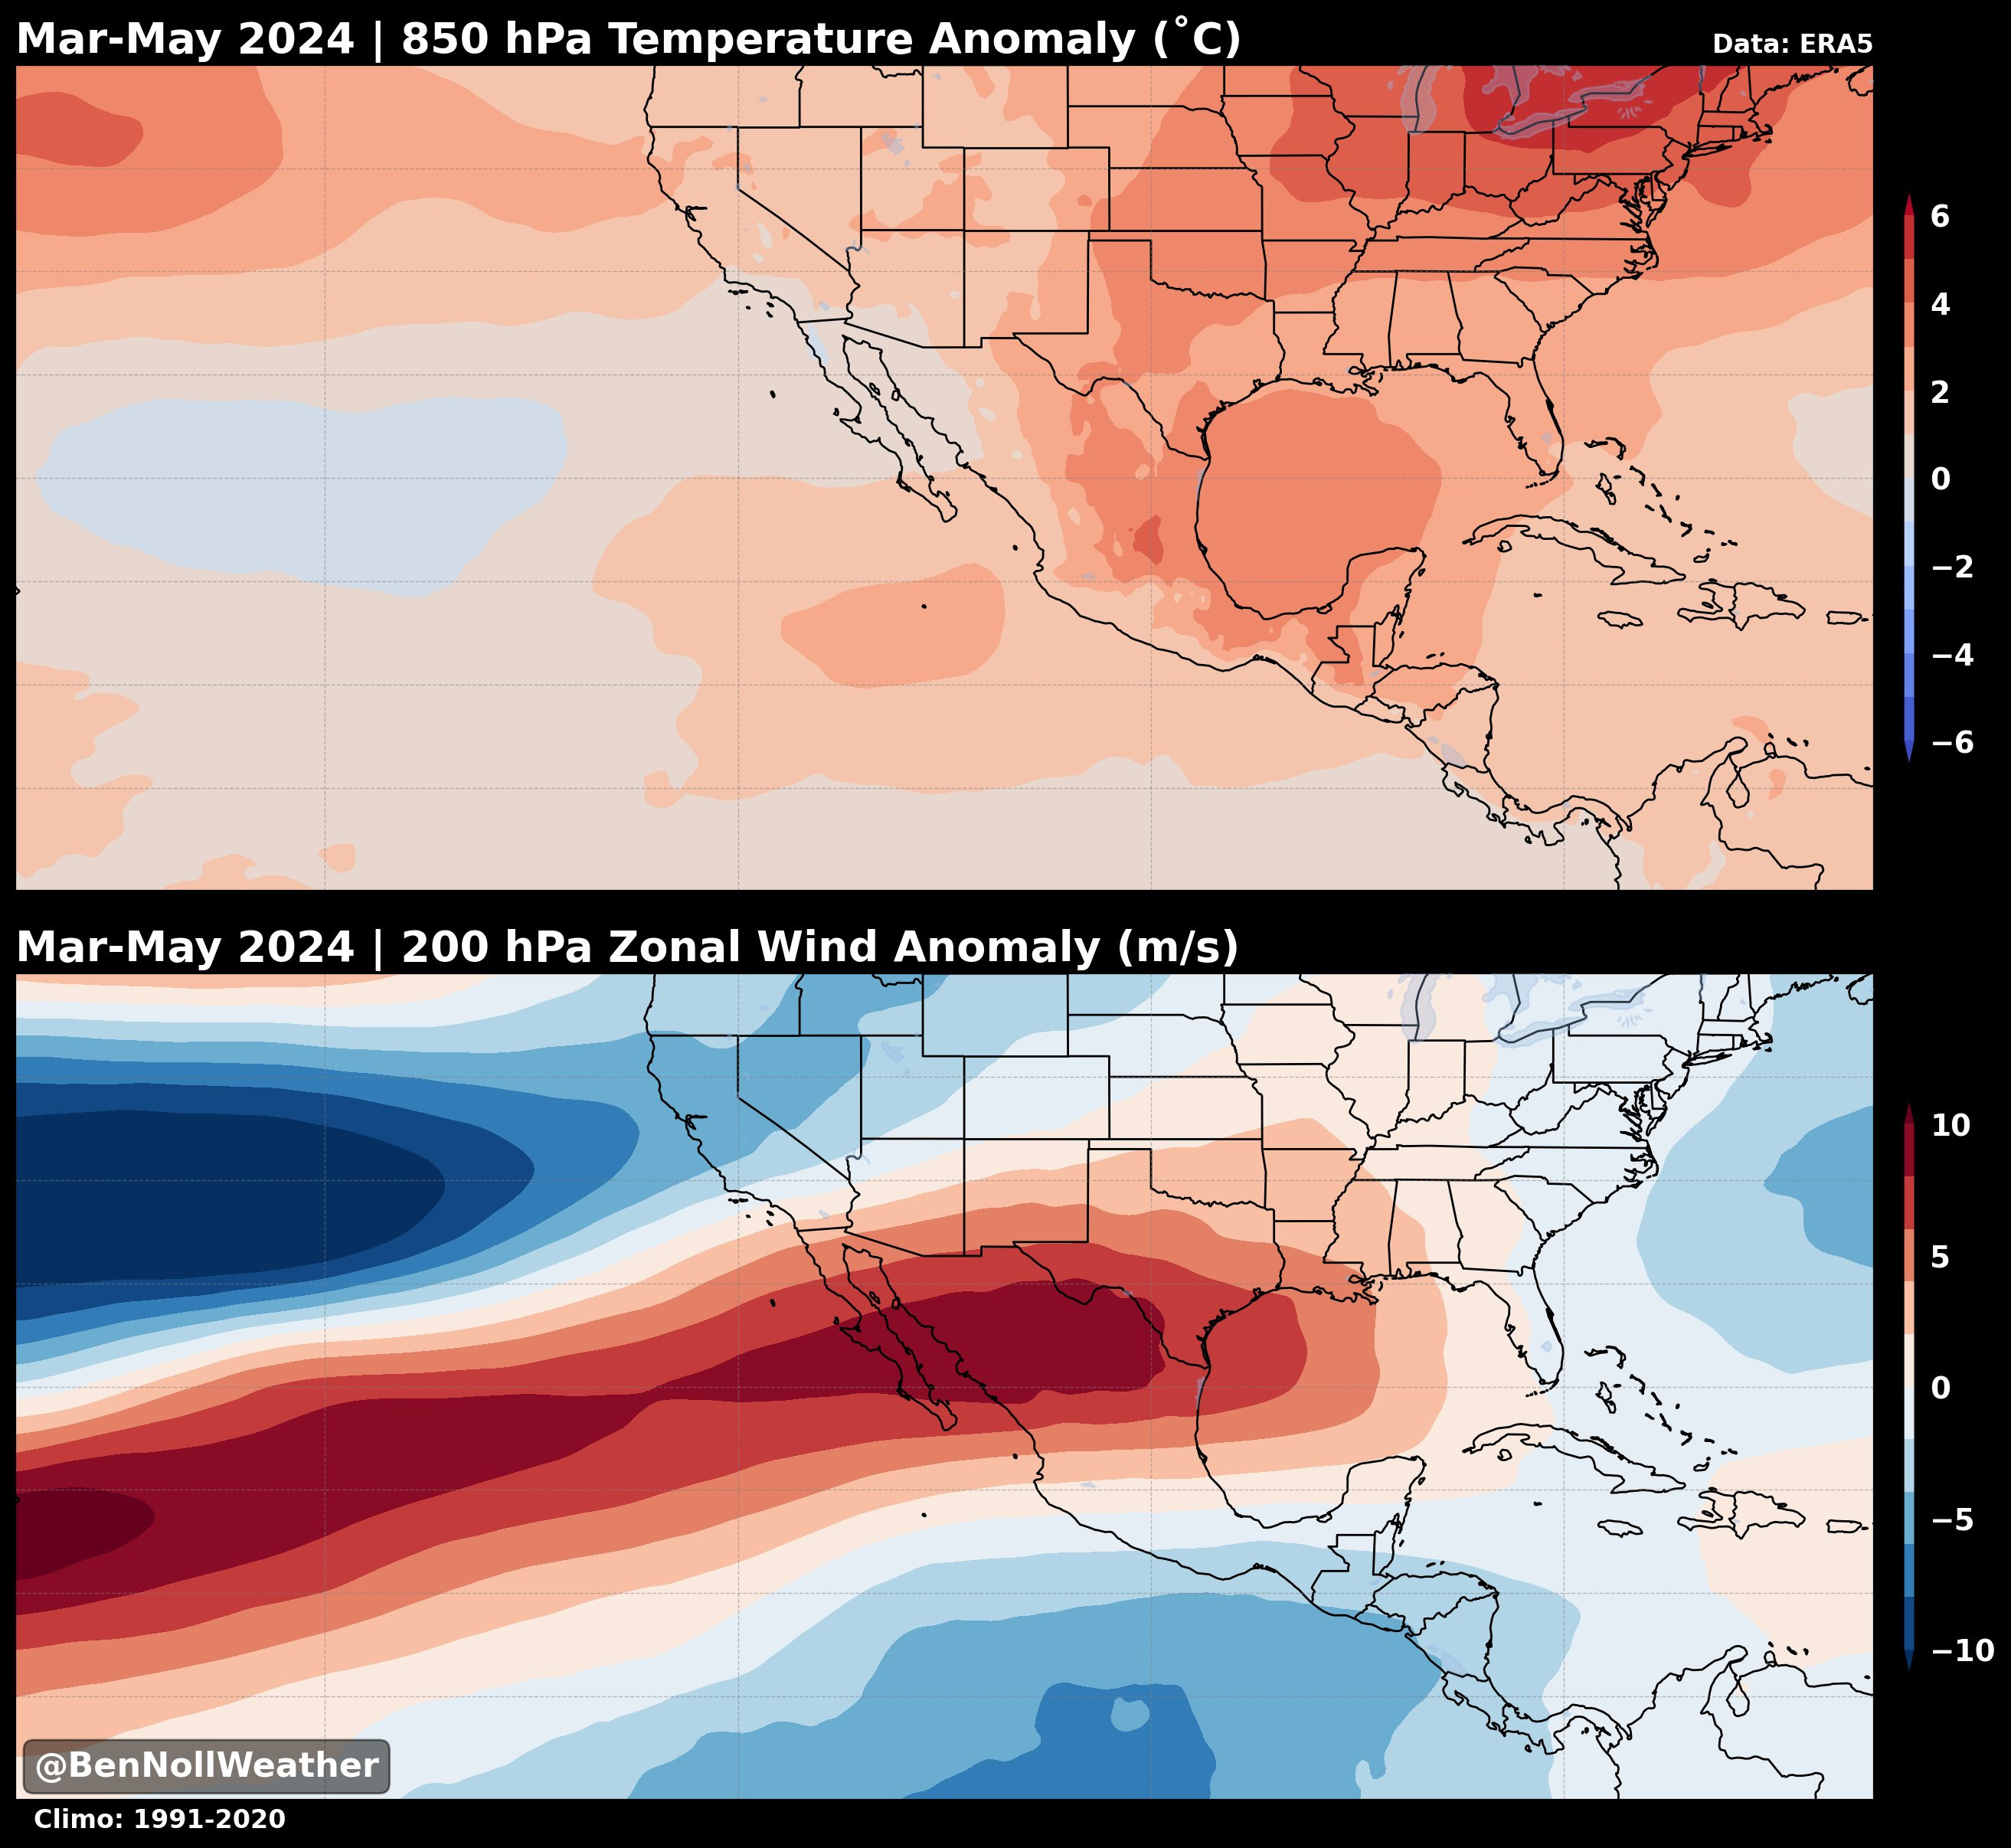
The other glaring impact of climate change: over the course of May, a historic area of high pressure plopped down on Mexico / Central America and refused to move. The general idea is this high took advantage of an Niño-related jet stream anomaly of Pacific Ocean warmth. Per Ben Noll,
“This climatic event warrants further investigation but may well be a case where El Niño's impacts and related teleconnections were enhanced by excessive tropical ocean heat.”
That created:
Record heat and humidity in Florida starting in Mid-May. As temperatures topped 100°, records fell. The all-time highest heat index was tied for the state at 115° in the Keys…in May.
Steered a destructive derecho in Houston on May 16th, resulting in at least four fatalities. That was the same complex that flooded Bryan-College Station during the 5pm rush hour.
Records including the hottest temperature in Belize (108°), the hottest May temperature in North America in Gallinas, Mexico (124°), and the hottest day recorded in the Yucatan Peninsula (113°).
Oh..and one more thing (that will finally let the title to this post make sense): a LOT of haze muddling up the Texas sky. This intense heat created wildfires across large portions of Mexico. As this heat dome sat in place, the smoke lofted into our sky, decreasing air quality and taking away the spring blue in between the rounds of stormy views.
What is listed above is just a smattering of impacts from this event that is ongoing. In fact, if you are reading this as it comes out somewhere between Texas and the Western U.S., that same dome of heat is being amplified north to bring excessive heat as far north as parts of the Pacific Northwest through the first weekend of June.
While we can see the synoptic pattern clearly on any print-out from a weather model, we can use attribution science to understand how much a finger print of climate change had. Climate Central’s Climate Shift Index persisetntly showed the dangerous and unrelenting heat over Mexico, Florida, and parts of Texas were made at least 5 times (and in many instances more) more likely to occur on either side of the Gulf of Mexico in the month of May.

Oh…and as for what what Ben sees in the long range forecast data on how this heat dome will play out as we hit the stride of the summer heat?
“The pattern shows signs of continuing into June, but could eventually be alleviated by the arrival of hurricane season...”
Be in touch anytime. Your opinion always matters. We’ll see you on the next one.